808 CHAPTER 39. STATISTICAL TESTS
This involves the T distribution. We will assume Xk,k ≤ r+ 1 is an independent samplefrom a normal distribution having mean µ and variance σ2.
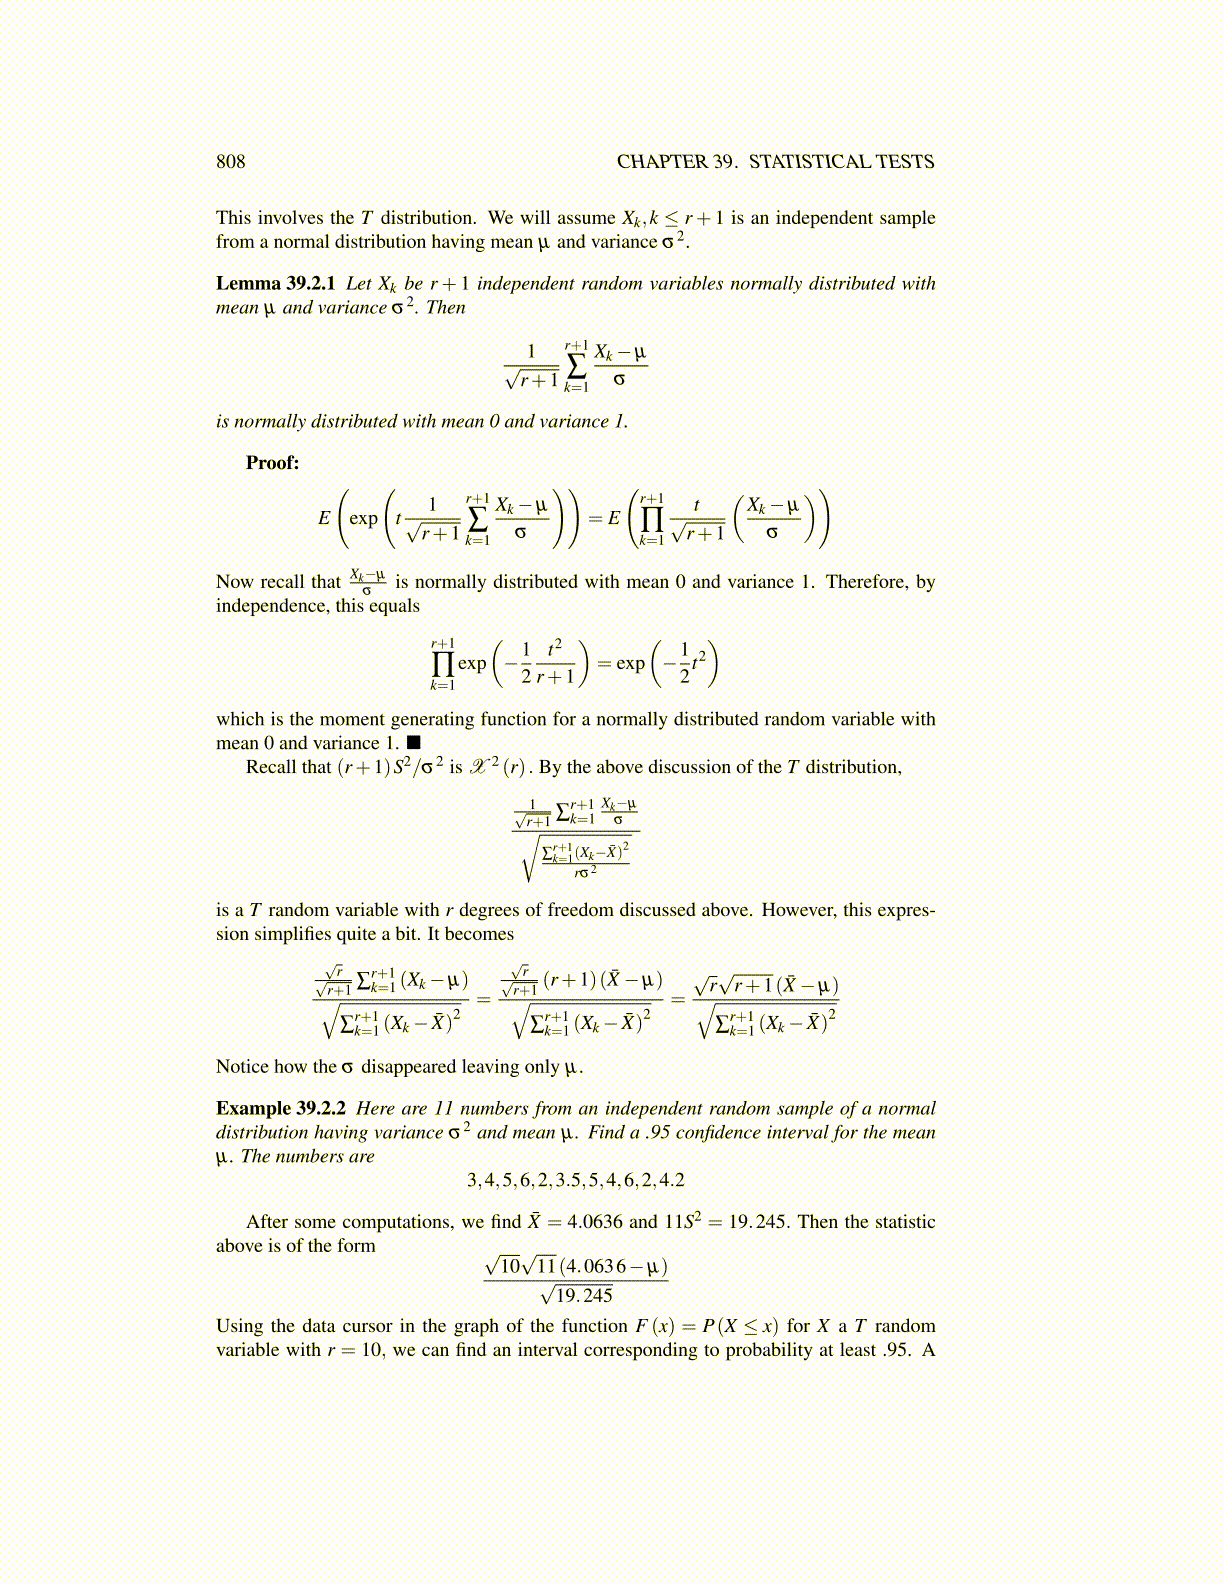
Lemma 39.2.1 Let Xk be r + 1 independent random variables normally distributed withmean µ and variance σ2. Then
1√r+1
r+1
∑k=1
Xk−µ
σ
is normally distributed with mean 0 and variance 1.
Proof:
E
(exp
(t
1√r+1
r+1
∑k=1
Xk−µ
σ
))= E
(r+1
∏k=1
t√r+1
(Xk−µ
σ
))
Now recall that Xk−µ
σis normally distributed with mean 0 and variance 1. Therefore, by
independence, this equals
r+1
∏k=1
exp(−1
2t2
r+1
)= exp
(−1
2t2)
which is the moment generating function for a normally distributed random variable withmean 0 and variance 1. ■
Recall that (r+1)S2/σ2 is X 2 (r) . By the above discussion of the T distribution,
1√r+1 ∑
r+1k=1
Xk−µ
σ√∑
r+1k=1(Xk−X̄)2
rσ2
is a T random variable with r degrees of freedom discussed above. However, this expres-sion simplifies quite a bit. It becomes
√r√
r+1 ∑r+1k=1 (Xk−µ)√
∑r+1k=1 (Xk− X̄)
2=
√r√
r+1(r+1)(X̄−µ)√
∑r+1k=1 (Xk− X̄)
2=
√r√
r+1(X̄−µ)√∑
r+1k=1 (Xk− X̄)
2
Notice how the σ disappeared leaving only µ .
Example 39.2.2 Here are 11 numbers from an independent random sample of a normaldistribution having variance σ2 and mean µ . Find a .95 confidence interval for the meanµ . The numbers are
3,4,5,6,2,3.5,5,4,6,2,4.2
After some computations, we find X̄ = 4.0636 and 11S2 = 19.245. Then the statisticabove is of the form √
10√
11(4.0636−µ)√19.245
Using the data cursor in the graph of the function F (x) = P(X ≤ x) for X a T randomvariable with r = 10, we can find an interval corresponding to probability at least .95. A