39.2. THE T AND F DISTRIBUTIONS 807
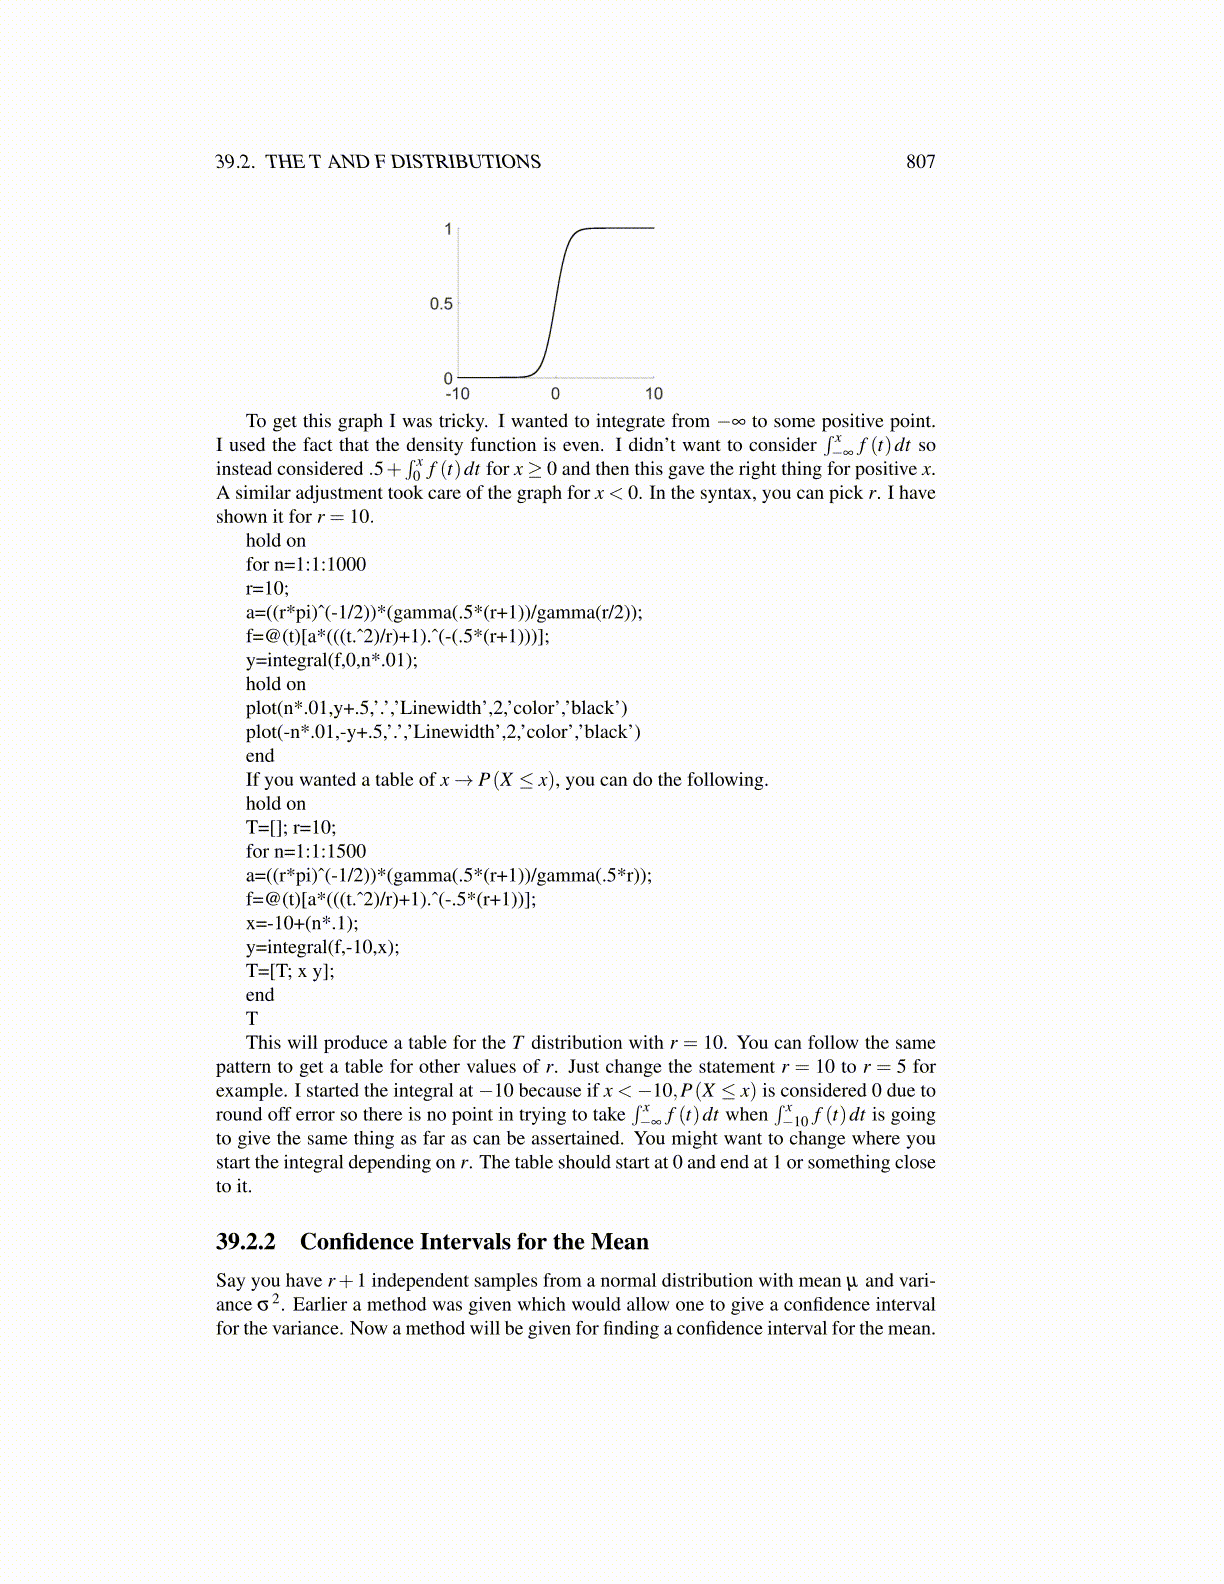
To get this graph I was tricky. I wanted to integrate from −∞ to some positive point.I used the fact that the density function is even. I didn’t want to consider
∫ x−∞
f (t)dt soinstead considered .5+
∫ x0 f (t)dt for x≥ 0 and then this gave the right thing for positive x.
A similar adjustment took care of the graph for x < 0. In the syntax, you can pick r. I haveshown it for r = 10.
hold onfor n=1:1:1000r=10;a=((r*pi)ˆ(-1/2))*(gamma(.5*(r+1))/gamma(r/2));f=@(t)[a*(((t.ˆ2)/r)+1).ˆ(-(.5*(r+1)))];y=integral(f,0,n*.01);hold onplot(n*.01,y+.5,’.’,’Linewidth’,2,’color’,’black’)plot(-n*.01,-y+.5,’.’,’Linewidth’,2,’color’,’black’)endIf you wanted a table of x→ P(X ≤ x), you can do the following.hold onT=[]; r=10;for n=1:1:1500a=((r*pi)ˆ(-1/2))*(gamma(.5*(r+1))/gamma(.5*r));f=@(t)[a*(((t.ˆ2)/r)+1).ˆ(-.5*(r+1))];x=-10+(n*.1);y=integral(f,-10,x);T=[T; x y];endTThis will produce a table for the T distribution with r = 10. You can follow the same
pattern to get a table for other values of r. Just change the statement r = 10 to r = 5 forexample. I started the integral at −10 because if x <−10,P(X ≤ x) is considered 0 due toround off error so there is no point in trying to take
∫ x−∞
f (t)dt when∫ x−10 f (t)dt is going
to give the same thing as far as can be assertained. You might want to change where youstart the integral depending on r. The table should start at 0 and end at 1 or something closeto it.
39.2.2 Confidence Intervals for the MeanSay you have r+1 independent samples from a normal distribution with mean µ and vari-ance σ2. Earlier a method was given which would allow one to give a confidence intervalfor the variance. Now a method will be given for finding a confidence interval for the mean.