39.2. THE T AND F DISTRIBUTIONS 809
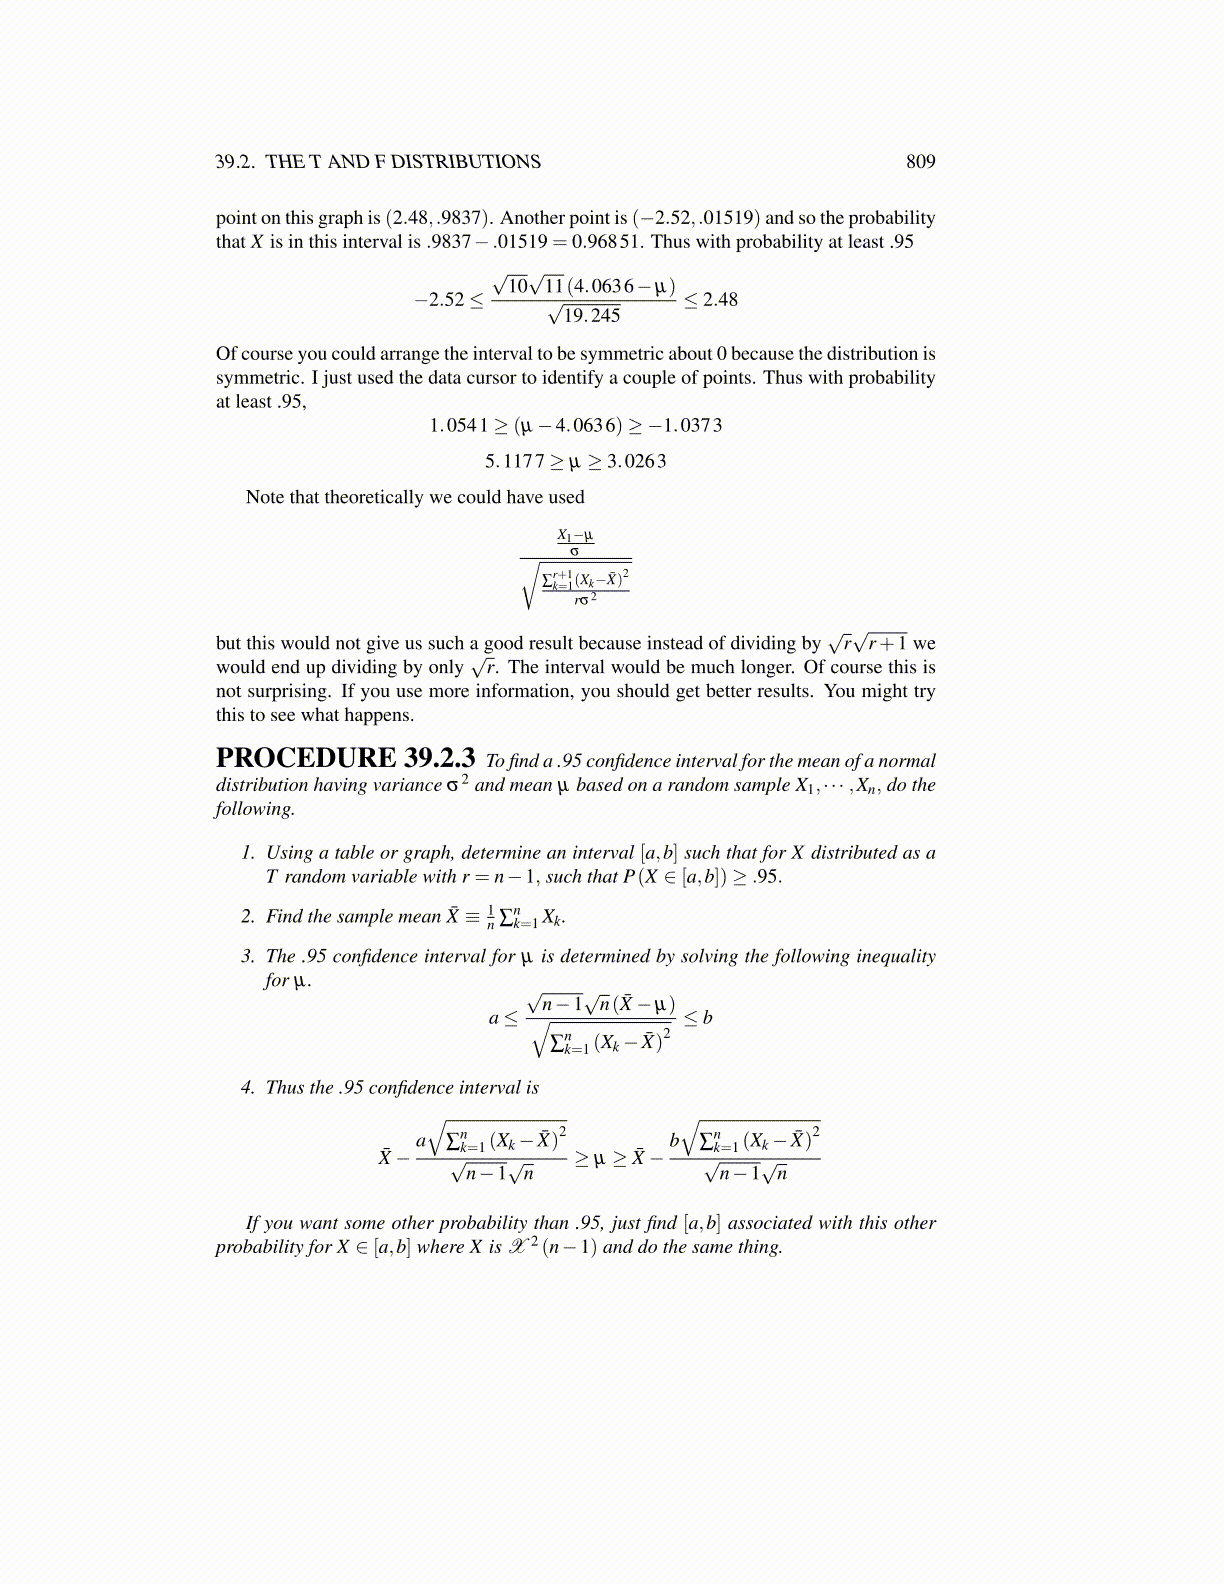
point on this graph is (2.48, .9837). Another point is (−2.52, .01519) and so the probabilitythat X is in this interval is .9837− .01519 = 0.96851. Thus with probability at least .95
−2.52≤√
10√
11(4.0636−µ)√19.245
≤ 2.48
Of course you could arrange the interval to be symmetric about 0 because the distribution issymmetric. I just used the data cursor to identify a couple of points. Thus with probabilityat least .95,
1.0541≥ (µ−4.0636)≥−1.0373
5.1177≥ µ ≥ 3.0263
Note that theoretically we could have used
X1−µ
σ√∑
r+1k=1(Xk−X̄)2
rσ2
but this would not give us such a good result because instead of dividing by√
r√
r+1 wewould end up dividing by only
√r. The interval would be much longer. Of course this is
not surprising. If you use more information, you should get better results. You might trythis to see what happens.
PROCEDURE 39.2.3 To find a .95 confidence interval for the mean of a normaldistribution having variance σ2 and mean µ based on a random sample X1, · · · ,Xn, do thefollowing.
1. Using a table or graph, determine an interval [a,b] such that for X distributed as aT random variable with r = n−1, such that P(X ∈ [a,b])≥ .95.
2. Find the sample mean X̄ ≡ 1n ∑
nk=1 Xk.
3. The .95 confidence interval for µ is determined by solving the following inequalityfor µ .
a≤√
n−1√
n(X̄−µ)√∑
nk=1 (Xk− X̄)
2≤ b
4. Thus the .95 confidence interval is
X̄−a√
∑nk=1 (Xk− X̄)
2
√n−1
√n
≥ µ ≥ X̄−b√
∑nk=1 (Xk− X̄)
2
√n−1
√n
If you want some other probability than .95, just find [a,b] associated with this otherprobability for X ∈ [a,b] where X is X 2 (n−1) and do the same thing.