814 CHAPTER 39. STATISTICAL TESTS
=Γ( r1+r2
2
)( r1r2
)r1/2
Γ(r1/2)Γ(r2/2)f (r1/2)−1(
f r1r2
+1) r1+r2
2
, f > 0
Note that if r1 = r2 = r, this is much less ugly. It then reduces to
Γ(r)
Γ(r/2)2f (r/2)−1
( f +1)r
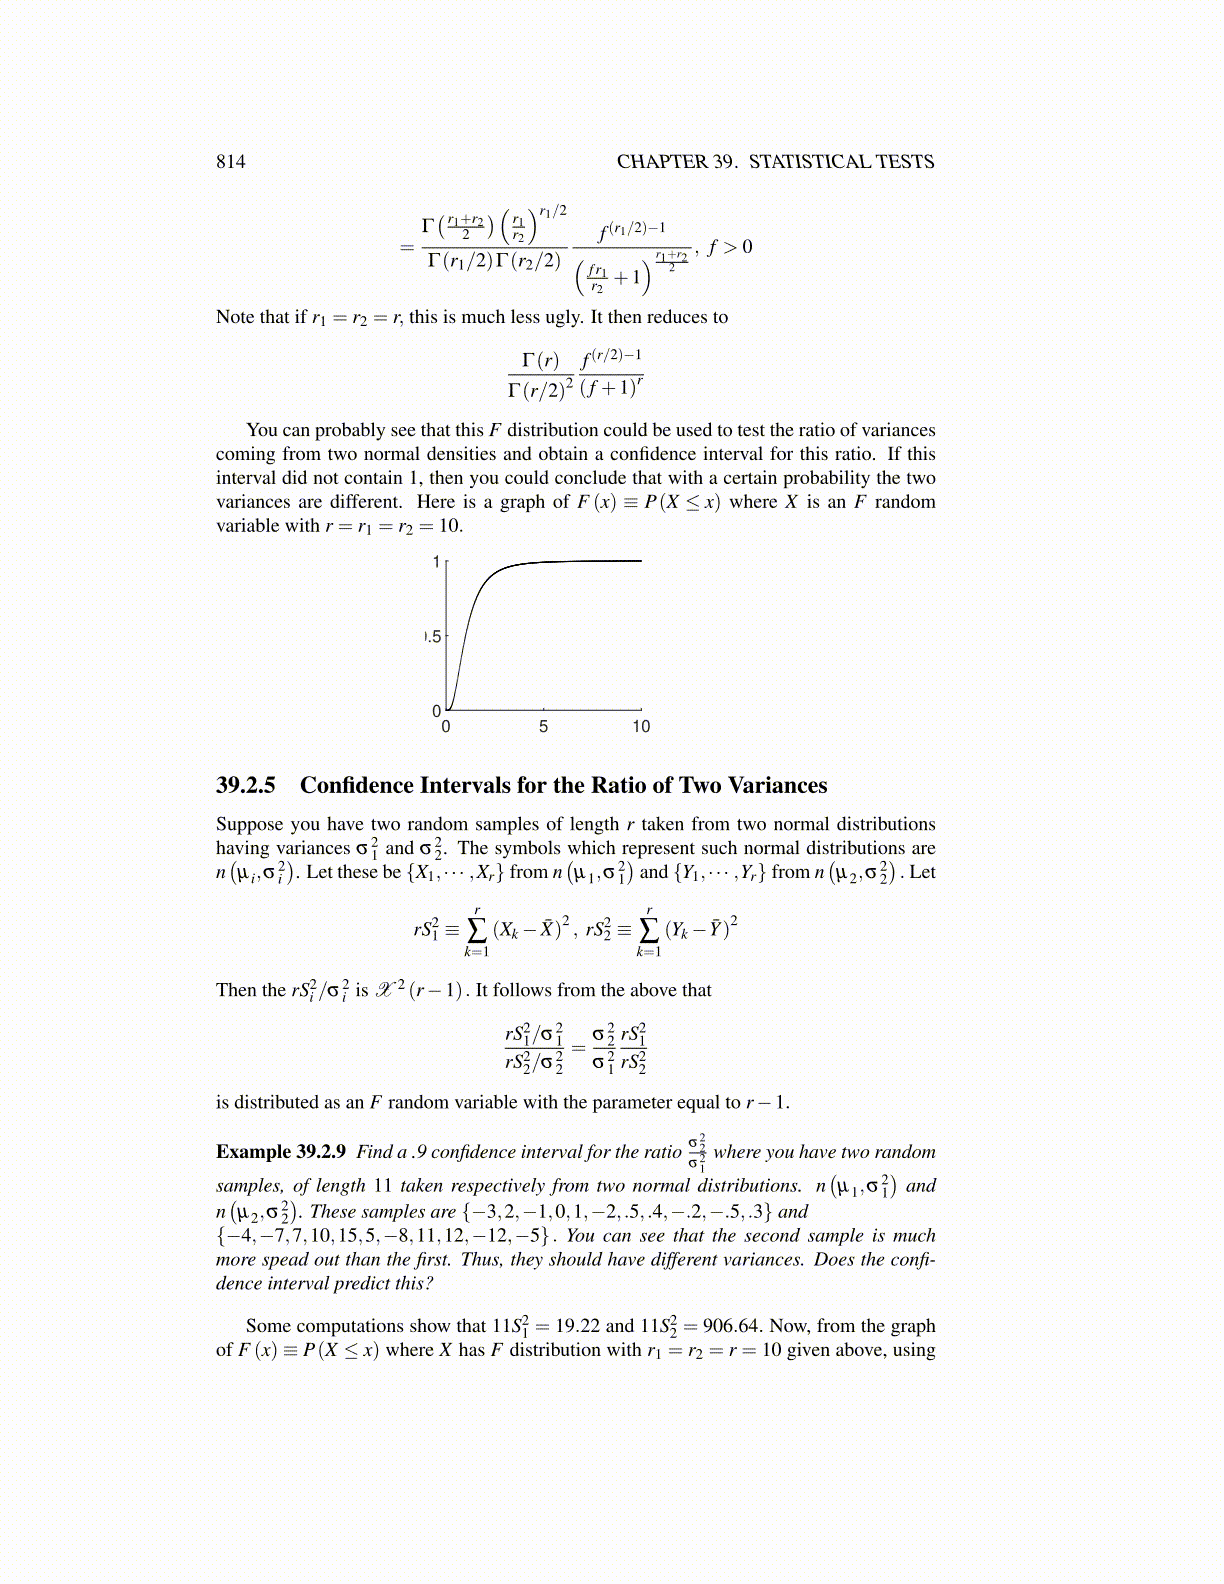
You can probably see that this F distribution could be used to test the ratio of variancescoming from two normal densities and obtain a confidence interval for this ratio. If thisinterval did not contain 1, then you could conclude that with a certain probability the twovariances are different. Here is a graph of F (x) ≡ P(X ≤ x) where X is an F randomvariable with r = r1 = r2 = 10.
0 5 100
0.5
1
39.2.5 Confidence Intervals for the Ratio of Two VariancesSuppose you have two random samples of length r taken from two normal distributionshaving variances σ2
1 and σ22. The symbols which represent such normal distributions are
n(µ i,σ
2i). Let these be {X1, · · · ,Xr} from n
(µ1,σ
21)
and {Y1, · · · ,Yr} from n(µ2,σ
22). Let
rS21 ≡
r
∑k=1
(Xk− X̄)2, rS2
2 ≡r
∑k=1
(Yk− Ȳ )2
Then the rS2i /σ2
i is X 2 (r−1) . It follows from the above that
rS21/σ2
1
rS22/σ2
2=
σ22
σ21
rS21
rS22
is distributed as an F random variable with the parameter equal to r−1.
Example 39.2.9 Find a .9 confidence interval for the ratio σ22
σ21
where you have two random
samples, of length 11 taken respectively from two normal distributions. n(µ1,σ
21)
andn(µ2,σ
22). These samples are {−3,2,−1,0,1,−2, .5, .4,−.2,−.5, .3} and
{−4,−7,7,10,15,5,−8,11,12,−12,−5} . You can see that the second sample is muchmore spead out than the first. Thus, they should have different variances. Does the confi-dence interval predict this?
Some computations show that 11S21 = 19.22 and 11S2
2 = 906.64. Now, from the graphof F (x)≡ P(X ≤ x) where X has F distribution with r1 = r2 = r = 10 given above, using